tune_map.html
Fine-Tuning the Spectral Map
Now that we have an initial map file, we can run adjust-map to fine-tune our solutions using a larger set of lamp features. First, we edit the parameter file:
editpar adjust-map
./adjust-map.par

type q to end

SEARCH_HEIGHT           10       half height of search range
SEARCH_WIDTH            10       half-width of search range
SLIT_WIDTH               5       slit width
ORD_DISP                 3       order of dispersion error fit
ORD_SAG                  1       order of y-distortion error fit
ORD_TILT                 1       order of tilt error fit
FIT_TILT                 y       fit slit tilt?
MINLINES                 5       minimum # of lines for tweak
LINELIST        HeNeAr_short.dat       line list file
EDGE                     2       slit edge to exclude
SIGLIMIT          8.000000       line rejection threshold in dispersion
ITERATIONS               5       number of iterations
OUTLIER-WT               y       underweight outlying point?
NCLUMP                   6       number of points in clumps for underweighting
HISTOGRAM                y       use histogram to reject lines outside
				 search region?
Notice that I used the HeNeAr_short.dat line list so that fewer lines are included in the error fits to prevent confusion. Another option would be to use the full HeNeAr.dat line list to attempt to get more accurate wavelength solutions, but setting SIGLIMIT to something lower may be wise if you choose to do so.
The adjust-map program outputs three files:
| file | description |
| ift0012.map | new, adjusted map file |
| ift0012.rms | standard deviations in each error computation |
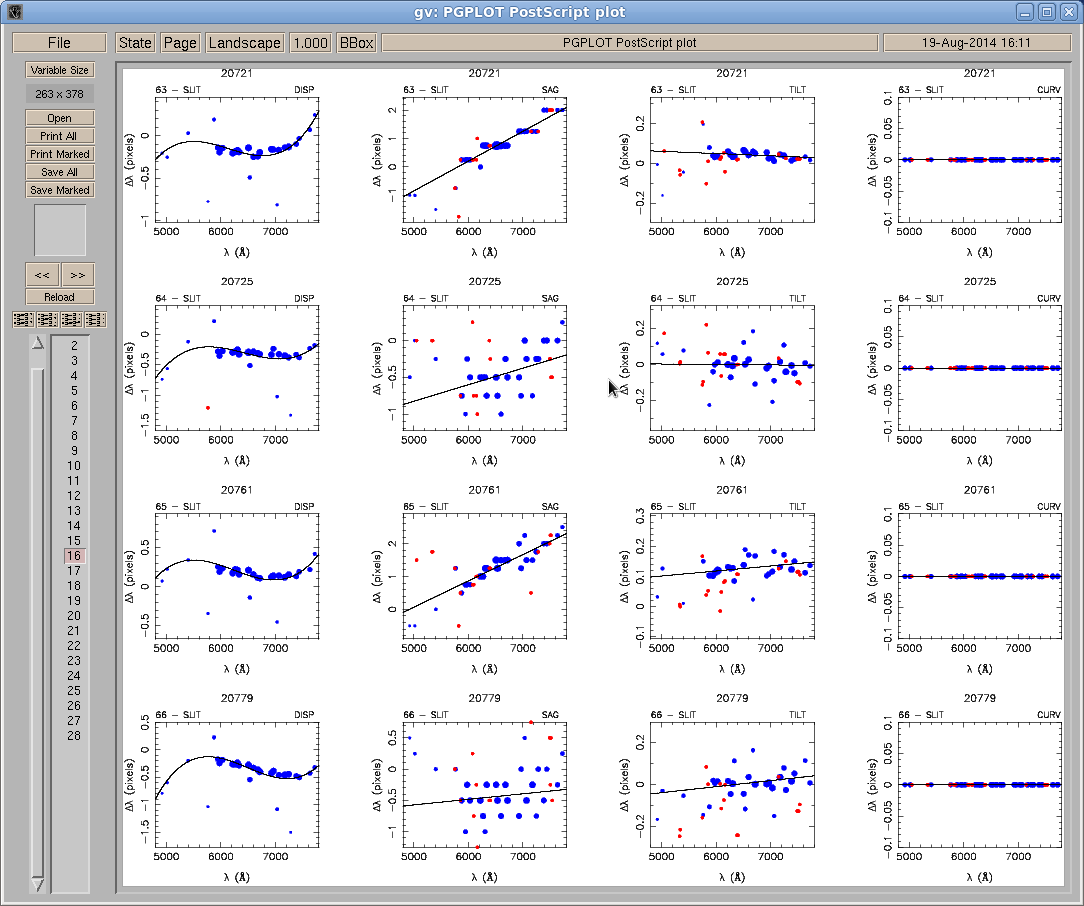
| ift0012.ps | plots of computed errors and fits |
The diagnostic plots in ift0012.ps are very useful for checking the spread of the errors and the quality of the fits. You can use these plots to see whether you need to use a different order for fitting the errors (see Figure 5). The blue dots represent the errors that were factored in the fits, whereas the red dots indicate which errors were excluded, based on the value of SIGLIMIT.
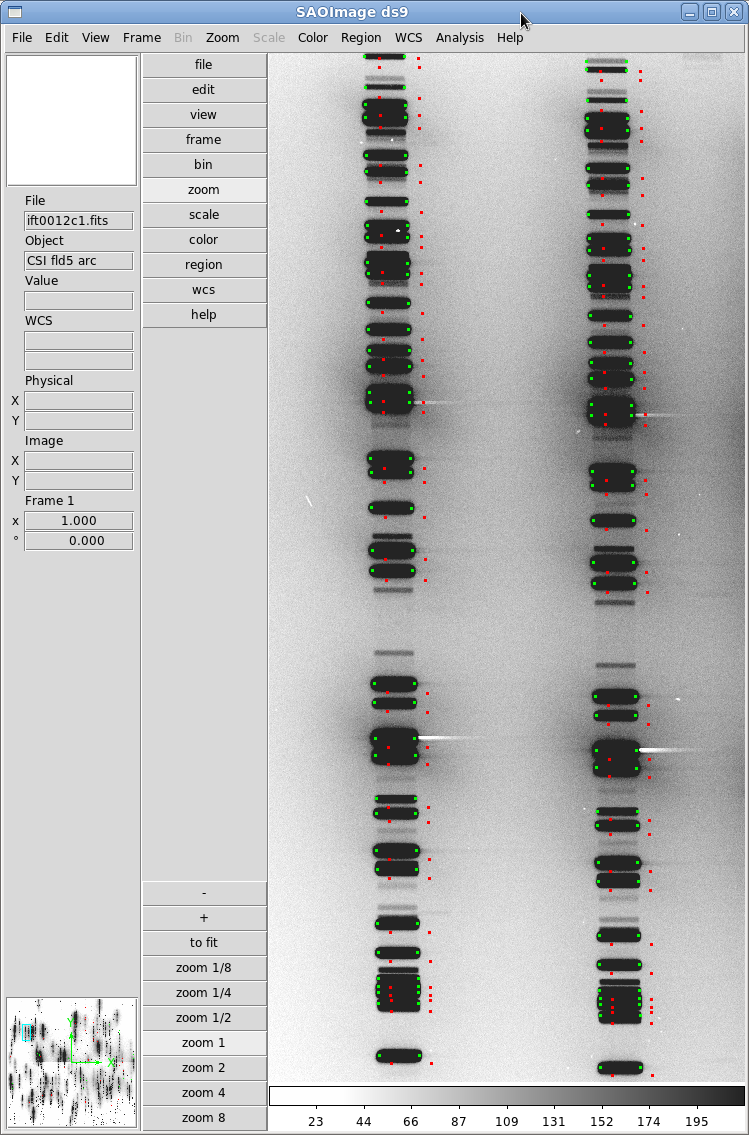
You can also check the quality of the map by generating a file with the positions of the lamp features, this time using spectral-map. For example, we can run the following command to use the map file we just produced:
spectral-map -m ift0012 -l HeNeAr.dat -b 1 -e
Then, we could overplot the coordinates in the resulting ift0012.xy file onto the lamp mosaic in ds9 using the display8 and tvmark routines in IRAF. Your spectral map at this point should be quite good. Figure 6 shows how well the positions in ift0012.xy line up with the actual features.
|
Next: Reducing the Spectra Up: Constructing the Spectral Map Previous: Generating an Initial Map Contents
Edward Villanueva 2014-08-27